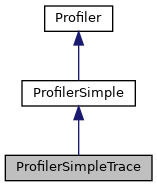
Execution trace. More...


Public Member Functions | |
| logData () | |
| Log the whole profiling data into the database. More... | |
| memoryDiff () | |
| profileIn ( $functionname) | |
| Called by wfProfieIn() More... | |
| profileOut ( $functionname) | |
| Called by wfProfieOut() More... | |
 Public Member Functions inherited from ProfilerSimple Public Member Functions inherited from ProfilerSimple | |
| getErrorEntry () | |
| getFunctionReport () | |
| Returns a list of profiled functions. More... | |
| getRawData () | |
| getZeroEntry () | |
| isPersistent () | |
| Return whether this profiler stores data. More... | |
| setMinimum ( $min) | |
| updateEntry ( $name, $elapsedCpu, $elapsedReal) | |
 Public Member Functions inherited from Profiler Public Member Functions inherited from Profiler | |
| __construct ( $params) | |
| calltreeCount ( $stack, $start) | |
| Counts the number of profiled function calls sitting under the given point in the call graph. More... | |
| close () | |
| Close opened profiling sections. More... | |
| debug ( $s) | |
| Add an entry in the debug log file. More... | |
| debugGroup ( $group, $s) | |
| Add an entry in the debug log group. More... | |
| getCallTree () | |
| Returns a tree of function call instead of a list of functions. More... | |
| getCallTreeLine ( $entry) | |
| Callback to get a formatted line for the call tree. More... | |
| getCurrentSection () | |
| Get the function name of the current profiling section. More... | |
| getOutput () | |
| Returns a profiling output to be stored in debug file. More... | |
| getProfileID () | |
| getTime ( $metric=false) | |
| Get the initial time of the request, based either on $wgRequestTime or $wgRUstart. More... | |
| isStub () | |
| Return whether this a stub profiler. More... | |
| remapCallTree ( $stack) | |
| Recursive function the format the current profiling array into a tree. More... | |
| setProfileID ( $id) | |
| setTemplated ( $t) | |
| Mark this call as templated or not. More... | |
| transactionWritingIn ( $server, $db) | |
| Mark a DB as in a transaction with one or more writes pending. More... | |
| transactionWritingOut ( $server, $db) | |
| Mark a DB as no longer in a transaction. More... | |
Public Attributes | |
| $memory = 0 | |
| $trace = "Beginning trace: \n" | |
 Public Attributes inherited from ProfilerSimple Public Attributes inherited from ProfilerSimple | |
| $errorEntry | |
| $mMinimumTime = 0 | |
 Public Attributes inherited from Profiler Public Attributes inherited from Profiler | |
| $mCalls = array() | |
| $mCollated = array() | |
| $mCollateDone = false | |
| $mPeriods = array() | |
| $mTemplated = false | |
| $mTotals = array() | |
| $mWorkStack = array() | |
Additional Inherited Members | |
 Static Public Member Functions inherited from Profiler Static Public Member Functions inherited from Profiler | |
| static | instance () |
| Singleton. More... | |
| static | setInstance (Profiler $p) |
| Set the profiler to a specific profiler instance. More... | |
 Static Public Attributes inherited from Profiler Static Public Attributes inherited from Profiler | |
| static | $__instance = null |
 Protected Member Functions inherited from ProfilerSimple Protected Member Functions inherited from ProfilerSimple | |
| addInitialStack () | |
| Add the inital item in the stack. More... | |
 Protected Member Functions inherited from Profiler Protected Member Functions inherited from Profiler | |
| collateData () | |
| getContentType () | |
| Get the content type sent out to the client. More... | |
| getInitialTime ( $metric=false) | |
| Get the initial time of the request, based either on $wgRequestTime or $wgRUstart. More... | |
| updateTrxProfiling ( $method, $realtime) | |
| Register the name and time of a method for slow DB trx detection. More... | |
 Static Protected Member Functions inherited from Profiler Static Protected Member Functions inherited from Profiler | |
| static | calculateOverhead ( $profileCount) |
| Dummy calls to wfProfileIn/wfProfileOut to calculate its overhead. More... | |
 Protected Attributes inherited from Profiler Protected Attributes inherited from Profiler | |
| $mDBLockThreshold = 5.0 | |
| $mDBTrxHoldingLocks = array() | |
| $mDBTrxMethodTimes = array() | |
| $mProfileID = false | |
| $mStack = array() | |
| $mTimeMetric = 'wall' | |
Detailed Description
Member Function Documentation
◆ logData()
| ProfilerSimpleTrace::logData | ( | ) |
Log the whole profiling data into the database.
Reimplemented from ProfilerSimple.
Definition at line 73 of file ProfilerSimpleTrace.php.
References Profiler\getContentType().
◆ memoryDiff()
| ProfilerSimpleTrace::memoryDiff | ( | ) |
Definition at line 67 of file ProfilerSimpleTrace.php.
References $memory, and memory.
Referenced by profileIn(), and profileOut().
◆ profileIn()
| ProfilerSimpleTrace::profileIn | ( | $functionname | ) |
Called by wfProfieIn()
- Parameters
-
$functionname String
Reimplemented from ProfilerSimple.
Definition at line 33 of file ProfilerSimpleTrace.php.
References memoryDiff().
◆ profileOut()
| ProfilerSimpleTrace::profileOut | ( | $functionname | ) |
Called by wfProfieOut()
- Parameters
-
$functionname String
Reimplemented from ProfilerSimple.
Definition at line 39 of file ProfilerSimpleTrace.php.
References Profiler\debug(), Profiler\getTime(), global, list, memoryDiff(), and Profiler\updateTrxProfiling().
Member Data Documentation
◆ $memory
| ProfilerSimpleTrace::$memory = 0 |
Definition at line 31 of file ProfilerSimpleTrace.php.
Referenced by memoryDiff().
◆ $trace
| ProfilerSimpleTrace::$trace = "Beginning trace: \n" |
Definition at line 30 of file ProfilerSimpleTrace.php.
The documentation for this class was generated from the following file:
- includes/profiler/ProfilerSimpleTrace.php
