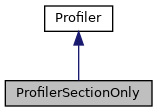
Profiler that only tracks explicit profiling sections. More...
Public Member Functions | |
| __construct (array $params=[]) | |
| close () | |
| Close opened profiling sections. More... | |
| getFunctionStats () | |
| Get the aggregated inclusive profiling data for each method. More... | |
| getOutput () | |
| Returns a profiling output to be stored in debug file. More... | |
| scopedProfileIn ( $section) | |
| Mark the start of a custom profiling frame (e.g. More... | |
 Public Member Functions inherited from Profiler Public Member Functions inherited from Profiler | |
| getContentType () | |
| Get the content type sent out to the client. More... | |
| getContext () | |
| Gets the context for this Profiler. More... | |
| getProfileID () | |
| getTemplated () | |
| Was this call as templated or not. More... | |
| getTransactionProfiler () | |
| logData () | |
| Log the data to the backing store for all ProfilerOutput instances that have one. More... | |
| logDataPageOutputOnly () | |
| Log the data to the script/request output for all ProfilerOutput instances that do so. More... | |
| profileIn ( $functionname) | |
| profileOut ( $functionname) | |
| scopedProfileOut (SectionProfileCallback &$section=null) | |
| setContext ( $context) | |
| Sets the context for this Profiler. More... | |
| setProfileID ( $id) | |
| setTemplated ( $t) | |
| Mark this call as templated or not. More... | |
Protected Member Functions | |
| getFunctionReport () | |
| Get a report of profiled functions sorted by inclusive wall clock time in descending order. More... | |
Protected Attributes | |
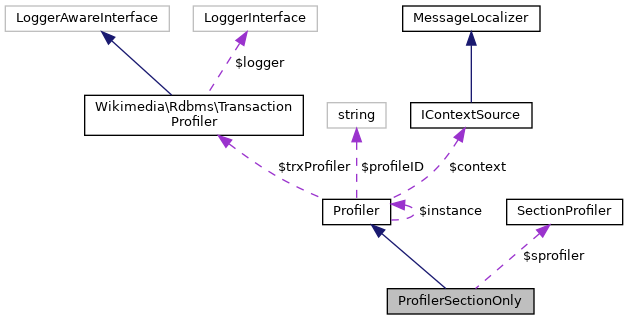
| SectionProfiler | $sprofiler |
| Protected Attributes inherited from Profiler | |
| IContextSource | $context = null |
| Current request context. More... | |
| array | $params = [] |
| All of the params passed from $wgProfiler. More... | |
| string bool | $profileID = false |
| Profiler ID for bucketing data. More... | |
| bool | $templated = false |
| Whether MediaWiki is in a SkinTemplate output context. More... | |
| TransactionProfiler | $trxProfiler |
Additional Inherited Members | |
| Static Public Member Functions inherited from Profiler | |
| static | instance () |
| Singleton. More... | |
| static | replaceStubInstance (Profiler $profiler) |
| Replace the current profiler with $profiler if no non-stub profiler is set. More... | |
Detailed Description
Profiler that only tracks explicit profiling sections.
- Since
- 1.25
Definition at line 33 of file ProfilerSectionOnly.php.
Constructor & Destructor Documentation
◆ __construct()
| ProfilerSectionOnly::__construct | ( | array | $params = [] | ) |
- Parameters
-
array $params
Reimplemented from Profiler.
Definition at line 37 of file ProfilerSectionOnly.php.
References Profiler\$params.
Member Function Documentation
◆ close()
| ProfilerSectionOnly::close | ( | ) |
Close opened profiling sections.
Reimplemented from Profiler.
Definition at line 46 of file ProfilerSectionOnly.php.
◆ getFunctionReport()
|
protected |
Get a report of profiled functions sorted by inclusive wall clock time in descending order.
Each line of the report includes this data:
- Function name
- Number of times function was called
- Total wall clock time spent in function in microseconds
- Minimum wall clock time spent in function in microseconds
- Average wall clock time spent in function in microseconds
- Maximum wall clock time spent in function in microseconds
- Percentage of total wall clock time spent in function
- Total delta of memory usage from start to end of function in bytes
- Returns
- string
Definition at line 73 of file ProfilerSectionOnly.php.
References $data, $out, as, and getFunctionStats().
Referenced by getOutput().
◆ getFunctionStats()
| ProfilerSectionOnly::getFunctionStats | ( | ) |
Get the aggregated inclusive profiling data for each method.
The percent time for each time is based on the current "total" time used is based on all methods so far. This method can therefore be called several times in between several profiling calls without the delays in usage of the profiler skewing the results. A "-total" entry is always included in the results.
When a call chain involves a method invoked within itself, any entries for the cyclic invocation should be be demarked with "@". This makes filtering them out easier and follows the xhprof style.
- Returns
- array List of method entries arrays, each having:
- name : method name
- calls : the number of invoking calls
- real : real time elapsed (ms)
- real : percent real time
- cpu : CPU time elapsed (ms)
- cpu : percent CPU time
- memory : memory used (bytes)
- memory : percent memory used
- min_real : min real time in a call (ms)
- max_real : max real time in a call (ms)
- Since
- 1.25
Reimplemented from Profiler.
Definition at line 49 of file ProfilerSectionOnly.php.
Referenced by getFunctionReport().
◆ getOutput()
| ProfilerSectionOnly::getOutput | ( | ) |
Returns a profiling output to be stored in debug file.
- Returns
- string
Reimplemented from Profiler.
Definition at line 53 of file ProfilerSectionOnly.php.
References getFunctionReport().
◆ scopedProfileIn()
| ProfilerSectionOnly::scopedProfileIn | ( | $section | ) |
Mark the start of a custom profiling frame (e.g.
DB queries). The frame ends when the result of this method falls out of scope.
- Parameters
-
string $section
- Returns
- ScopedCallback|null
- Since
- 1.25
Reimplemented from Profiler.
Definition at line 42 of file ProfilerSectionOnly.php.
References $section.
Member Data Documentation
◆ $sprofiler
|
protected |
Definition at line 35 of file ProfilerSectionOnly.php.
The documentation for this class was generated from the following file:
- includes/profiler/ProfilerSectionOnly.php