Profiler that captures all function calls from the XHProf PHP extension. More...
Public Member Functions | |
| __construct (array $params=[]) | |
| close () | |
| No-op for xhprof profiling. | |
| getFunctionStats () | |
| Get the aggregated inclusive profiling data for each method. | |
| getOutput () | |
| Returns a profiling output to be stored in debug file. | |
| getRawData () | |
| Retrieve raw data from xhprof. | |
| getXhprofData () | |
| scopedProfileIn ( $section) | |
| Mark the start of a custom profiling frame (e.g. | |
 Public Member Functions inherited from Profiler Public Member Functions inherited from Profiler | |
| getAllowOutput () | |
| Whether appending profiles is allowed. | |
| getContentType () | |
| Get the Content-Type for deciding how to format appended profile output. | |
| getContext () | |
| getProfileID () | |
| getTransactionProfiler () | |
| logData () | |
| Log the data to the backing store for all ProfilerOutput instances that have one. | |
| logDataPageOutputOnly () | |
| Log the data to the script/request output for all ProfilerOutput instances that do so. | |
| scopedProfileOut (SectionProfileCallback &$section=null) | |
| setAllowOutput () | |
| Enable appending profiles to standard output. | |
| setContext ( $context) | |
| setProfileID ( $id) | |
Protected Member Functions | |
| getFunctionReport () | |
| Get a report of profiled functions sorted by inclusive wall clock time in descending order. | |
Protected Attributes | |
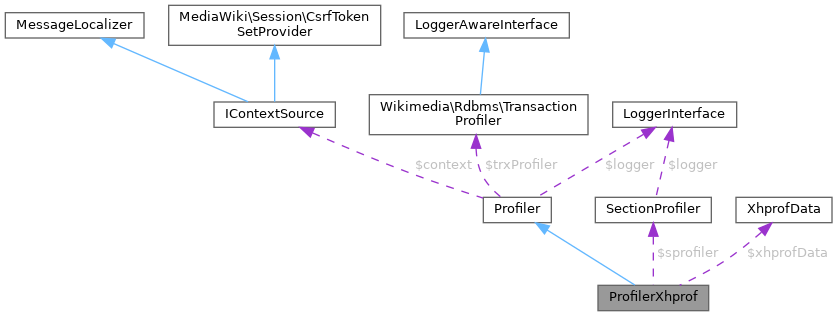
| SectionProfiler | $sprofiler |
| Profiler for explicit, arbitrary, frame labels. | |
| XhprofData null | $xhprofData |
| Protected Attributes inherited from Profiler | |
| IContextSource | $context = null |
| Current request context. | |
| LoggerInterface | $logger |
| array | $params = [] |
| All of the params passed from $wgProfiler. | |
| string bool | $profileID = false |
| Profiler ID for bucketing data. | |
| TransactionProfiler | $trxProfiler |
Additional Inherited Members | |
| Static Public Member Functions inherited from Profiler | |
| static | instance () |
| Singleton. | |
| static | replaceStubInstance (Profiler $profiler) |
| Replace the current profiler with $profiler if no non-stub profiler is set. | |
Detailed Description
Profiler that captures all function calls from the XHProf PHP extension.
This extension can be installed via PECL or your operating system's package manager. This also supports the Tideways-XHProf PHP extension, as well as the older (discontinued) Tideways extension
Definition at line 36 of file ProfilerXhprof.php.
Constructor & Destructor Documentation
◆ __construct()
| ProfilerXhprof::__construct | ( | array | $params = [] | ) |
- See also
- $wgProfiler
- Parameters
-
array $params Associative array of parameters: - int flags: Bitmask of constants from the Xhprof or Tideways extension that will be passed to its enable function, such as
XHPROF_FLAGS_CPU | XHPROF_FLAGS_MEMORY | XHPROF_FLAGS_NO_BUILTINS. With Tideways-XHProf, useTIDEWAYS_XHPROF_FLAGS_*instead. - bool running: If true, it is assumed that the enable function was already called. The
flagsoption is ignored in this case. This exists for use with a custom web entrypoint from which the profiler is started before MediaWiki is included. - array include: If set, only function names matching a pattern in this array will be reported. The pattern strings will be matched using the PHP fnmatch() function.
array exclude: If set, function names matching an exact name in this will be skipped over by XHProf. Ignored functions become transparent in the profile. For example,
foo=>ignored=>barbecomesfoo=>bar. This option is backed by XHProf'signored_functionsoption.Note: The
excludeoption is not supported in Tideways-XHProf.
- int flags: Bitmask of constants from the Xhprof or Tideways extension that will be passed to its enable function, such as
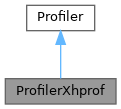
Reimplemented from Profiler.
Definition at line 69 of file ProfilerXhprof.php.
References Profiler\$params, and Xhprof\enable().
Member Function Documentation
◆ close()
| ProfilerXhprof::close | ( | ) |
No-op for xhprof profiling.
Reimplemented from Profiler.
Definition at line 103 of file ProfilerXhprof.php.
◆ getFunctionReport()
|
protected |
Get a report of profiled functions sorted by inclusive wall clock time in descending order.
Each line of the report includes this data:
- Function name
- Number of times function was called
- Total wall clock time spent in function in microseconds
- Minimum wall clock time spent in function in microseconds
- Average wall clock time spent in function in microseconds
- Maximum wall clock time spent in function in microseconds
- Percentage of total wall clock time spent in function
- Total delta of memory usage from start to end of function in bytes
- Returns
- string
Definition at line 203 of file ProfilerXhprof.php.
References getFunctionStats().
Referenced by getOutput().
◆ getFunctionStats()
| ProfilerXhprof::getFunctionStats | ( | ) |
Get the aggregated inclusive profiling data for each method.
The percent time for each time is based on the current "total" time used is based on all methods so far. This method can therefore be called several times in between several profiling calls without the delays in usage of the profiler skewing the results. A "-total" entry is always included in the results.
When a call chain involves a method invoked within itself, any entries for the cyclic invocation should be demarked with "@". This makes filtering them out easier and follows the xhprof style.
- Returns
- array[] List of method entries arrays, each having:
- name : method name
- calls : the number of invoking calls
- real : real time elapsed (ms)
- real : percent real time
- cpu : CPU time elapsed (ms)
- cpu : percent CPU time
- memory : memory used (bytes)
- memory : percent memory used
- min_real : min real time in a call (ms)
- max_real : max real time in a call (ms)
- Since
- 1.25
Reimplemented from Profiler.
Definition at line 134 of file ProfilerXhprof.php.
References getXhprofData().
Referenced by getFunctionReport().
◆ getOutput()
| ProfilerXhprof::getOutput | ( | ) |
Returns a profiling output to be stored in debug file.
- Returns
- string
Reimplemented from Profiler.
Definition at line 183 of file ProfilerXhprof.php.
References getFunctionReport().
◆ getRawData()
| ProfilerXhprof::getRawData | ( | ) |
Retrieve raw data from xhprof.
- Returns
- array
Definition at line 235 of file ProfilerXhprof.php.
References getXhprofData().
◆ getXhprofData()
| ProfilerXhprof::getXhprofData | ( | ) |
- Returns
- XhprofData
Definition at line 88 of file ProfilerXhprof.php.
References $xhprofData, and Xhprof\disable().
Referenced by getFunctionStats(), and getRawData().
◆ scopedProfileIn()
| ProfilerXhprof::scopedProfileIn | ( | $section | ) |
Mark the start of a custom profiling frame (e.g.
DB queries). The frame ends when the result of this method falls out of scope.
- Parameters
-
string $section
- Returns
- ScopedCallback|null
- Since
- 1.25
Reimplemented from Profiler.
Definition at line 95 of file ProfilerXhprof.php.
Member Data Documentation
◆ $sprofiler
|
protected |
Profiler for explicit, arbitrary, frame labels.
Definition at line 46 of file ProfilerXhprof.php.
◆ $xhprofData
|
protected |
Definition at line 40 of file ProfilerXhprof.php.
Referenced by getXhprofData().
The documentation for this class was generated from the following file:
- includes/profiler/ProfilerXhprof.php