Arbitrary section name based PHP profiling. More...
Public Member Functions | |
| __construct (array $params=[]) | |
| getFunctionStats () | |
| Get the aggregated inclusive profiling data for each method. | |
| profileInInternal ( $functionname) | |
| This method should not be called outside SectionProfiler. | |
| profileOutInternal ( $functionname) | |
| This method should not be called outside SectionProfiler. | |
| reset () | |
| Clear all of the profiling data for another run. | |
| scopedProfileIn ( $section) | |
| scopedProfileOut (ScopedCallback &$section) | |
Protected Member Functions | |
| collateData () | |
| Populate collated data. | |
| getErrorEntry () | |
| getTime ( $metric='wall') | |
| Get the initial time of the request, based on getrusage() | |
| getZeroEntry () | |
| updateEntry ( $name, $elapsedCpu, $elapsedReal, $memChange) | |
| Update the collation entry for a given method name. | |
Protected Attributes | |
| array[] | $collated = [] |
| Map of (function name => aggregate data array) | |
| bool | $collateDone = false |
| array null | $end |
| Map of (mem,real,cpu) | |
| array | $errorEntry |
| Cache of a standard broken collation entry. | |
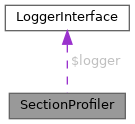
| LoggerInterface | $logger |
| array[] | $stack = [] |
| List of resolved profile calls with start/end data. | |
| array null | $start |
| Map of (mem,real,cpu) | |
| array | $workStack = [] |
| Queue of open profile calls with start data. | |
Detailed Description
Arbitrary section name based PHP profiling.
This custom profiler can track code execution that doesn't cleanly map to a function call and thus can't be handled by ProfilerXhprof or ProfilerExcimer. For example, parser invocations or DB queries.
- Since
- 1.25
Definition at line 35 of file SectionProfiler.php.
Constructor & Destructor Documentation
◆ __construct()
| SectionProfiler::__construct | ( | array | $params = [] | ) |
- Parameters
-
array $params
Definition at line 57 of file SectionProfiler.php.
References getErrorEntry().
Member Function Documentation
◆ collateData()
|
protected |
Populate collated data.
Definition at line 273 of file SectionProfiler.php.
References profileOutInternal().
Referenced by getFunctionStats().
◆ getErrorEntry()
|
protected |
- Returns
- array Initial collation entry for errors
Definition at line 174 of file SectionProfiler.php.
References getZeroEntry().
Referenced by __construct().
◆ getFunctionStats()
| SectionProfiler::getFunctionStats | ( | ) |
Get the aggregated inclusive profiling data for each method.
The percent time for each time is based on the current "total" time used is based on all methods so far. This method can therefore be called several times in between several profiling calls without the delays in usage of the profiler skewing the results. A "-total" entry is always included in the results.
- Returns
- array[] List of method entries arrays, each having:
- name : method name
- calls : the number of invoking calls
- real : real time elapsed (ms)
- real : percent real time
- cpu : real time elapsed (ms)
- cpu : percent real time
- memory : memory used (bytes)
- memory : percent memory used
- min_real : min real time in a call (ms)
- max_real : max real time in a call (ms)
Definition at line 100 of file SectionProfiler.php.
References collateData().
◆ getTime()
|
protected |
Get the initial time of the request, based on getrusage()
- Parameters
-
string | bool $metric Metric to use, with the following possibilities: - user: User CPU time (without system calls)
- cpu: Total CPU time (user and system calls)
- wall (or any other string): elapsed time
- false (default): will fall back to default metric
- Returns
- float
Definition at line 294 of file SectionProfiler.php.
Referenced by profileInInternal(), and profileOutInternal().
◆ getZeroEntry()
|
protected |
- Returns
- array Initial collation entry
Definition at line 160 of file SectionProfiler.php.
Referenced by getErrorEntry(), and updateEntry().
◆ profileInInternal()
| SectionProfiler::profileInInternal | ( | $functionname | ) |
This method should not be called outside SectionProfiler.
- Parameters
-
string $functionname
Definition at line 207 of file SectionProfiler.php.
References getTime().
Referenced by scopedProfileIn().
◆ profileOutInternal()
| SectionProfiler::profileOutInternal | ( | $functionname | ) |
This method should not be called outside SectionProfiler.
- Parameters
-
string $functionname
Definition at line 235 of file SectionProfiler.php.
References getTime(), and updateEntry().
Referenced by collateData().
◆ reset()
| SectionProfiler::reset | ( | ) |
Clear all of the profiling data for another run.
Definition at line 148 of file SectionProfiler.php.
◆ scopedProfileIn()
| SectionProfiler::scopedProfileIn | ( | $section | ) |
- Parameters
-
string $section
- Returns
- SectionProfileCallback
Definition at line 66 of file SectionProfiler.php.
References profileInInternal().
◆ scopedProfileOut()
| SectionProfiler::scopedProfileOut | ( | ScopedCallback & | $section | ) |
- Parameters
-
ScopedCallback &$section
Definition at line 75 of file SectionProfiler.php.
◆ updateEntry()
|
protected |
Update the collation entry for a given method name.
- Parameters
-
string $name float $elapsedCpu float $elapsedReal int $memChange
Definition at line 188 of file SectionProfiler.php.
References getZeroEntry().
Referenced by profileOutInternal().
Member Data Documentation
◆ $collated
|
protected |
Map of (function name => aggregate data array)
Definition at line 45 of file SectionProfiler.php.
◆ $collateDone
|
protected |
Definition at line 47 of file SectionProfiler.php.
◆ $end
|
protected |
Map of (mem,real,cpu)
Definition at line 39 of file SectionProfiler.php.
◆ $errorEntry
|
protected |
Cache of a standard broken collation entry.
Definition at line 50 of file SectionProfiler.php.
◆ $logger
|
protected |
Definition at line 52 of file SectionProfiler.php.
◆ $stack
|
protected |
List of resolved profile calls with start/end data.
Definition at line 41 of file SectionProfiler.php.
◆ $start
|
protected |
Map of (mem,real,cpu)
Definition at line 37 of file SectionProfiler.php.
◆ $workStack
|
protected |
Queue of open profile calls with start data.
Definition at line 43 of file SectionProfiler.php.
The documentation for this class was generated from the following file:
- includes/profiler/SectionProfiler.php